Linux jprobe的使用和原理
文章目录
- 前言
- 一、demo
- 1.1 demo演示
- 1.2 struct jprobe
- 二、jprobe 原理
- 2.1 原理简介
- 1.2 原理详解
- 三、源码解析
- 3.1 struct jprobe
- 3.2 register_jprobe
- 3.3 setjmp_pre_handler
- 3.4 jprobe_return
- 3.5 longjmp_break_handler
- 四、Deprecated Features
- 五、使用 perf-probe 获取函数参数
- 总结
- 参考资料
前言
现在介绍jprobe。kprobe提供三种探测手段:kprobe、kretprobe和jprobe,其中kretprobe和jprobe基于kprobe实现,分别应用于不同探测场景中。
kretprobe基于kprobe实现,用于获取被探测函数的返回值。
jprobe基于kprobe实现,它用于获取被探测函数的入参值。
高版本的内核已经不支持 jprobe,我使用的是centos 7进行代码测试和 3.10.0 内核源码分析。
一、demo
1.1 demo演示
仍然拿_do_fork() 举例,_do_fork() 是Linux内核用来创建新任务的函数接口。
由于jprobe使用来获取探测函数的入参值,主要看一下_do_fork函数的参数:
long _do_fork(unsigned long clone_flags,unsigned long stack_start,unsigned long stack_size,int __user *parent_tidptr,int __user *child_tidptr,unsigned long tls)
/** Here's a sample kernel module showing the use of jprobes to dump* the arguments of _do_fork().** For more information on theory of operation of jprobes, see* Documentation/kprobes.txt** Build and insert the kernel module as done in the kprobe example.* You will see the trace data in /var/log/messages and on the* console whenever _do_fork() is invoked to create a new process.* (Some messages may be suppressed if syslogd is configured to* eliminate duplicate messages.)*/#include
#include
#include /** Jumper probe for _do_fork.* Mirror principle enables access to arguments of the probed routine* from the probe handler.*//* Proxy routine having the same arguments as actual _do_fork() routine */
static long j_do_fork(unsigned long clone_flags, unsigned long stack_start,unsigned long stack_size, int __user *parent_tidptr,int __user *child_tidptr, unsigned long tls)
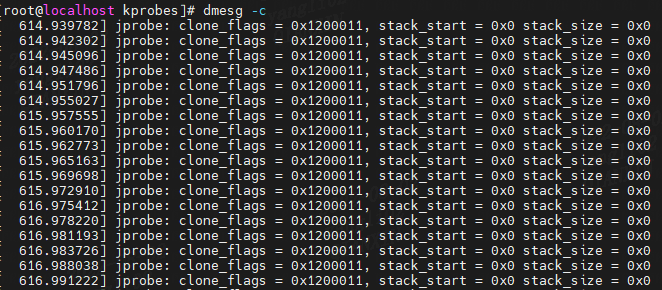
{pr_info("jprobe: clone_flags = 0x%lx, stack_start = 0x%lx ""stack_size = 0x%lx\n", clone_flags, stack_start, stack_size);/* Always end with a call to jprobe_return(). */jprobe_return();return 0;
}static struct jprobe my_jprobe = {.entry = j_do_fork,.kp = {.symbol_name = "_do_fork",},
};static int __init jprobe_init(void)
{int ret;ret = register_jprobe(&my_jprobe);if (ret < 0) {pr_err("register_jprobe failed, returned %d\n", ret);return -1;}pr_info("Planted jprobe at %p, handler addr %p\n",my_jprobe.kp.addr, my_jprobe.entry);return 0;
}static void __exit jprobe_exit(void)
{unregister_jprobe(&my_jprobe);pr_info("jprobe at %p unregistered\n", my_jprobe.kp.addr);
}module_init(jprobe_init)
module_exit(jprobe_exit)
MODULE_LICENSE("GPL"); 结果:
(1)jprobe处理程序例程 j_do_fork 要和 待探测的内核函数 _do_fork()例程具有相同类型的参数和返回值类型。
(2)jprobe处理程序例程 j_do_fork执行完毕以后,必须调用jprobe_return函数结尾。
1.2 struct jprobe
/** Special probe type that uses setjmp-longjmp type tricks to resume* execution at a specified entry with a matching prototype corresponding* to the probed function - a trick to enable arguments to become* accessible seamlessly by probe handling logic.* Note:* Because of the way compilers allocate stack space for local variables* etc upfront, regardless of sub-scopes within a function, this mirroring* principle currently works only for probes placed on function entry points.*/
struct jprobe {struct kprobe kp;void *entry;	/* probe handling code to jump to */
};/* For backward compatibility with old code using JPROBE_ENTRY() */
#define JPROBE_ENTRY(handler)	(handler)
由于jprobe基于kprobe实现的,可以看到struct jprobe结构体中内嵌了struct kprobe结构体。
static struct jprobe my_jprobe = {.entry			= j_do_fork,.kp = {.symbol_name	= "_do_fork",},
};
struct kprobe {....../* Allow user to indicate symbol name of the probe point */const char *symbol_name;......
};
二、jprobe 原理
2.1 原理简介
jprobe是使用放置在函数入口点上的kprobe实现的,它采用简单的镜像原理,允许无缝访问被探测函数的参数。jprobe处理程序例程应该与被探测的函数具有相同的签名(参数列表和返回类型),并且必须始终以调用Kprobes函数jprobe_return()结束。
当探针(probe)被击中时,Kprobes会复制保存的寄存器和堆栈的一部分,然后,Kprobes将保存的指令指针指向jprobe的处理程序例程,并从陷阱(trap)中返回。因此,控制权传递给处理程序,处理程序与被探测函数具有相同的寄存器和堆栈内容。完成后,处理程序调用jprobe_return(),再次捕获以恢复原始堆栈内容和处理器状态,并切换到被探测的函数。
按照惯例,被调用者拥有自己的参数,因此gcc可能会生成意外修改堆栈中该部分的代码。这就是Kprobes保存堆栈副本并在jprobe处理程序运行后恢复堆栈的原因。最多复制MAX_STACK_SIZE字节。
注意,被探测函数的参数可以在堆栈或寄存器中传递。无论哪种情况,只要处理程序的原型与被探测函数的原型匹配,jprobe都可以工作。
1.2 原理详解
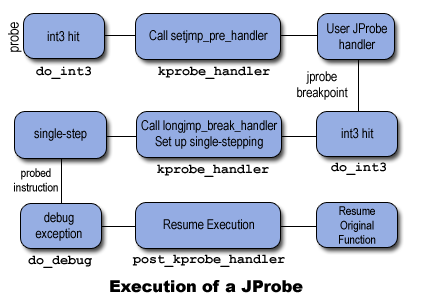
JProbe必须将控制权转移到与放置探针的功能具有相同原型的另一个功能,然后将控制权以与执行JProbe之前相同的状态返回到原始功能。JProbe利用KProbe使用的机制。JProbe不调用用户定义的 pre-handler,而是指定自己的 pre-handler 函数setjmp_pre_handler(),并使用另一个处理函数break_handler。分为三个过程:
(1)第一步:当断点被命中时,控制到达kprobe_handler(),它调用jprobe pre-handler(setjmp_pre_handler())。这将在将rip(指令寄存器:指向下一条即将执行指令的地址)更改为用户定义函数的地址之前保存堆栈内容和寄存器。然后它返回1,告诉kprobe_handler() 简单地返回,而不是像kprobe那样设置单步执行。返回时,control 到达用户定义的函数以访问原始函数的参数。当用户定义的函数完成时,它调用jprobe_return() 而不是执行正常返回。
(2)第二步:jprobe_return() 截断当前堆栈帧并生成一个断点,该断点通过do_int3() 将控制权传递给kprobe_handler()。kprobe_handler() 发现生成的断点地址(jprobe_handller() 中int3指令的地址)没有注册的探测点,但是KProbes在当前CPU上处于活动状态。它假定断点必须是由 jprobes 生成的,因此调用了先前保存的current_kprobe的break_handler。break_handler还原在将控制权传递给用户定义函数之前保存的堆栈内容和寄存器,并返回。
(3)第三步:kprobe_handler() 然后设置jprobe指令的单步执行,后续与kprobe原理相同。
备注:jprobe 的 pre-handler函数:setjmp_pre_handler() 和 break_handler函数:longjmp_break_handler(),这两个函数不是用户定义的函数,而是在内核中已经设置好了,setjmp_pre_handler()负责在遇到探测点保存原始调用上下文,longjmp_break_handler()负责在离开探测点时恢复原始调用上下文。
上下文就是指探测函数点的一系列寄存器和堆栈内容,通过上下文信息返回原来的探测点正常执行路径。
jprobe需要保存探测点上下文信息,而kprobe不需要。
三、源码解析
3.1 struct jprobe
/** Special probe type that uses setjmp-longjmp type tricks to resume* execution at a specified entry with a matching prototype corresponding* to the probed function - a trick to enable arguments to become* accessible seamlessly by probe handling logic.* Note:* Because of the way compilers allocate stack space for local variables* etc upfront, regardless of sub-scopes within a function, this mirroring* principle currently works only for probes placed on function entry points.*/
struct jprobe {struct kprobe kp;void *entry;	/* probe handling code to jump to */
};/* For backward compatibility with old code using JPROBE_ENTRY() */
#define JPROBE_ENTRY(handler)	(handler)
struct jprobe 是一种特殊的探测类型,它使用setjmp-longjmp类型技巧,以与被探测函数对应的匹配原型在指定的条目处恢复执行,这是一种技巧,使参数能够通过探测处理逻辑无缝访问。
由于编译器为本地变量等预先分配堆栈空间的方式,无论函数内的子作用域如何,这种镜像原则目前只适用于放置在函数入口点上的探测。
struct jprobe 用到的struct kprobe 的相关成员如下:
struct kprobe {....../* Allow user to indicate symbol name of the probe point */const char *symbol_name;....../* Called before addr is executed. */kprobe_pre_handler_t pre_handler;....../** ... called if breakpoint trap occurs in probe handler.* Return 1 if it handled break, otherwise kernel will see it.*/kprobe_break_handler_t break_handler;......
};
3.2 register_jprobe
int __kprobes register_jprobe(struct jprobe *jp)
{return register_jprobes(&jp, 1);
}
EXPORT_SYMBOL_GPL(register_jprobe);
unsigned long __weak arch_deref_entry_point(void *entry)
{return (unsigned long)entry;
}int __kprobes register_jprobes(struct jprobe **jps, int num)
{struct jprobe *jp;int ret = 0, i;if (num <= 0)return -EINVAL;for (i = 0; i < num; i++) {unsigned long addr, offset;jp = jps[i];addr = arch_deref_entry_point(jp->entry);/* Verify probepoint is a function entry point */if (kallsyms_lookup_size_offset(addr, NULL, &offset) &&offset == 0) {jp->kp.pre_handler = setjmp_pre_handler;jp->kp.break_handler = longjmp_break_handler;ret = register_kprobe(&jp->kp);} elseret = -EINVAL;if (ret < 0) {if (i > 0)unregister_jprobes(jps, i);break;}}return ret;
}
EXPORT_SYMBOL_GPL(register_jprobes);
(1)从jp->entry中取出探测回调函数的地址,调用 kallsyms_lookup_size_offset 验证 probe point是否为函数入口点。kallsyms_lookup_size_offset函数的作用是从内核或者模块的符号表中找到addr地址所在的符号,找到后会通过offset值返回addr与符号起始的偏移,这偏移值必须为0,即必须为一个函数的入口。
(2)如果探测回调函数是函数的入口,则设置 struct jprobe 的 struct kprobe成员变量 pre_handler 为 setjmp_pre_handler,break_handler为 longjmp_break_handler,调用 register_kprobe 注册 kprobe点。
3.3 setjmp_pre_handler
// linux-3.10/arch/x86/include/asm/ptrace.hstruct pt_regs {unsigned long r15;unsigned long r14;unsigned long r13;unsigned long r12;unsigned long bp;unsigned long bx;
/* arguments: non interrupts/non tracing syscalls only save up to here*/unsigned long r11;unsigned long r10;unsigned long r9;unsigned long r8;unsigned long ax;unsigned long cx;unsigned long dx;unsigned long si;unsigned long di;unsigned long orig_ax;
/* end of arguments */
/* cpu exception frame or undefined */unsigned long ip;unsigned long cs;unsigned long flags;unsigned long sp;unsigned long ss;
/* top of stack page */
};
// linux-3.10/arch/x86/kernel/kprobes/core.cDEFINE_PER_CPU(struct kprobe_ctlblk, kprobe_ctlblk);
// linux-3.10/arch/x86/include/asm/kprobes.h#ifdef CONFIG_KPROBES
DECLARE_PER_CPU(struct kprobe_ctlblk, kprobe_ctlblk);/* per-cpu kprobe control block */
struct kprobe_ctlblk {......unsigned long *jprobe_saved_sp;struct pt_regs jprobe_saved_regs;kprobe_opcode_t jprobes_stack[MAX_STACK_SIZE];......
};
jprobe_saved_sp用于保存sp寄存器信息,用来存储栈顶地址。
jprobe_saved_regs用于保存寄存器信息。
jprobes_stack则用于保存堆栈信息。
struct kprobe_ctlblk 是一个 per-cpu变量:
[root@localhost ~]# cat /proc/kallsyms | grep __per_cpu_start
0000000000000000 A __per_cpu_start
[root@localhost ~]# cat /proc/kallsyms | grep kprobe_ctlblk
0000000000013360 A kprobe_ctlblk
[root@localhost ~]# cat /proc/kallsyms | grep __per_cpu_end
000000000001d000 A __per_cpu_end
// linux-3.10/include/linux/kprobes.hstatic inline struct kprobe_ctlblk *get_kprobe_ctlblk(void)
{return (&__get_cpu_var(kprobe_ctlblk));
}
// linux-3.10/arch/x86/kernel/kprobes/core.cint __kprobes setjmp_pre_handler(struct kprobe *p, struct pt_regs *regs)
{struct jprobe *jp = container_of(p, struct jprobe, kp);unsigned long addr;struct kprobe_ctlblk *kcb = get_kprobe_ctlblk();//保存探测点上下文信息:寄存器和堆栈内容kcb->jprobe_saved_regs = *regs;kcb->jprobe_saved_sp = stack_addr(regs);//获取栈顶地址addr = (unsigned long)(kcb->jprobe_saved_sp);/** As Linus pointed out, gcc assumes that the callee* owns the argument space and could overwrite it, e.g.* tailcall optimization. So, to be absolutely safe* we also save and restore enough stack bytes to cover* the argument area.*/memcpy(kcb->jprobes_stack, (kprobe_opcode_t *)addr,MIN_STACK_SIZE(addr));regs->flags &= ~X86_EFLAGS_IF;//关闭中断trace_hardirqs_off();regs->ip = (unsigned long)(jp->entry);return 1;
}
当断点被命中时,控制到达kprobe_handler(),它调用Jprobe pre-handler即 setjmp_pre_handler() 函数,此函数在用户预定义的函数之前先执行,对于我们的示例中就是 j_do_fork() ,setjmp_pre_handler() 函数在 j_do_fork() 之前执行,setjmp_pre_handler保存了探测点上下文信息后,就将指令寄存去 ip 指向用户态回调函数 jp->entry,然后返回1,这里返回1,在kprobe_handler中会跳过单步模式,在kprobe_handler函数中不会执行setup_singlestep函数了。在jprobe 执行 break_handler :longjmp_break_handler函数 之前 跳过单步模式。之后再执行用户态回调函数 jp->entry :j_do_fork,获取相应的参数值。
备注:这里探测函数(j_do_fork)是在kprobe_handler流程执行完成后跳转执行的,跳过了single_step流程,这也就说它不能利用原有kprobe的机制回到原始执行流程中去执行。
kprobe不需要保存原上下文信息。
// linux-3.10/arch/x86/kernel/kprobes/core.c/** Interrupts are disabled on entry as trap3 is an interrupt gate and they* remain disabled throughout this function.*/
static int __kprobes kprobe_handler(struct pt_regs *regs)
{....../** If we have no pre-handler or it returned 0, we* continue with normal processing.  If we have a* pre-handler and it returned non-zero, it prepped* for calling the break_handler below on re-entry* for jprobe processing, so get out doing nothing* more here.*/if (!p->pre_handler || !p->pre_handler(p, regs))//在jprobe 执行 break_handler 之前 跳过单步模式setup_singlestep(p, regs, kcb, 0);return 1;......
}
执行用户自定义函数后,调用 jprobe_return 函数。
从setjmp_pre_handler的实现可以看出,该函数仅仅修改了kprobe的返回地址,并没有修改栈和其他的寄存器值,因此在CPU跳转到用户自定义函数:j_do_fork执行时,它的寄存器和栈中的内容同原本调用_do_fork函数时几乎是一模一样的(仅仅是禁用了中断而已),因此不论是通过寄存器传参还是通过压栈的方式传参,用户在定义jdo_fork函数时只需要将函数入参定义的同do_fork一样就可以轻轻松松的获取到原有的入参值了
3.4 jprobe_return
// linux-3.10/arch/x86/kernel/kprobes/core.cvoid __kprobes jprobe_return(void)
{struct kprobe_ctlblk *kcb = get_kprobe_ctlblk();asm volatile (
#ifdef CONFIG_X86_64"       xchg   %%rbx,%%rsp	\n"
#else"       xchgl   %%ebx,%%esp	\n"
#endif"       int3			\n""       .globl jprobe_return_end\n""       jprobe_return_end:	\n""       nop			\n"::"b"(kcb->jprobe_saved_sp):"memory");
}
在 jprobe_return 执行 int 3指令:
/* May run on IST stack. */
dotraplinkage void __kprobes notrace do_int3(struct pt_regs *regs, long error_code)
{......if (notify_die(DIE_INT3, "int3", regs, error_code, X86_TRAP_BP,SIGTRAP) == NOTIFY_STOP)goto exit;......
}
// linux-3.10/kernel/kprobes.cstatic struct notifier_block kprobe_exceptions_nb = {.notifier_call = kprobe_exceptions_notify,.priority = 0x7fffffff /* we need to be notified first */
};
// linux-3.10/kernel/notifier.c/*** notifier_call_chain - Informs the registered notifiers about an event.*	@nl:		Pointer to head of the blocking notifier chain*	@val:		Value passed unmodified to notifier function*	@v:		Pointer passed unmodified to notifier function*	@nr_to_call:	Number of notifier functions to be called. Don't care*			value of this parameter is -1.*	@nr_calls:	Records the number of notifications sent. Don't care*			value of this field is NULL.*	@returns:	notifier_call_chain returns the value returned by the*			last notifier function called.*/
static int __kprobes notifier_call_chain(struct notifier_block **nl,unsigned long val, void *v,int nr_to_call,	int *nr_calls)
{int ret = NOTIFY_DONE;struct notifier_block *nb, *next_nb;nb = rcu_dereference_raw(*nl);while (nb && nr_to_call) {next_nb = rcu_dereference_raw(nb->next);#ifdef CONFIG_DEBUG_NOTIFIERSif (unlikely(!func_ptr_is_kernel_text(nb->notifier_call))) {WARN(1, "Invalid notifier called!");nb = next_nb;continue;}
#endifret = nb->notifier_call(nb, val, v);if (nr_calls)(*nr_calls)++;if ((ret & NOTIFY_STOP_MASK) == NOTIFY_STOP_MASK)break;nb = next_nb;nr_to_call--;}return ret;
}/***	__atomic_notifier_call_chain - Call functions in an atomic notifier chain*	@nh: Pointer to head of the atomic notifier chain*	@val: Value passed unmodified to notifier function*	@v: Pointer passed unmodified to notifier function*	@nr_to_call: See the comment for notifier_call_chain.*	@nr_calls: See the comment for notifier_call_chain.**	Calls each function in a notifier chain in turn.  The functions*	run in an atomic context, so they must not block.*	This routine uses RCU to synchronize with changes to the chain.**	If the return value of the notifier can be and'ed*	with %NOTIFY_STOP_MASK then atomic_notifier_call_chain()*	will return immediately, with the return value of*	the notifier function which halted execution.*	Otherwise the return value is the return value*	of the last notifier function called.*/
int __kprobes __atomic_notifier_call_chain(struct atomic_notifier_head *nh,unsigned long val, void *v,int nr_to_call, int *nr_calls)
{int ret;rcu_read_lock();ret = notifier_call_chain(&nh->head, val, v, nr_to_call, nr_calls);rcu_read_unlock();return ret;
}
EXPORT_SYMBOL_GPL(__atomic_notifier_call_chain);int __kprobes atomic_notifier_call_chain(struct atomic_notifier_head *nh,unsigned long val, void *v)
{return __atomic_notifier_call_chain(nh, val, v, -1, NULL);
}
EXPORT_SYMBOL_GPL(atomic_notifier_call_chain);int notrace __kprobes notify_die(enum die_val val, const char *str,struct pt_regs *regs, long err, int trap, int sig)
{struct die_args args = {.regs	= regs,.str	= str,.err	= err,.trapnr	= trap,.signr	= sig,};return atomic_notifier_call_chain(&die_chain, val, &args);
}
int3-->do_int3-->notify_die(DIE_INT3, "int3", regs, error_code, X86_TRAP_BP,SIGTRAP) == NOTIFY_STOP)-->kprobe_exceptions_notify(){case DIE_INT3:if (kprobe_handler(args->regs))ret = NOTIFY_STOP;break;}
/** Interrupts are disabled on entry as trap3 is an interrupt gate and they* remain disabled throughout this function.*/
static int __kprobes kprobe_handler(struct pt_regs *regs)
{......} else if (kprobe_running()) {p = __this_cpu_read(current_kprobe);if (p->break_handler && p->break_handler(p, regs)) {if (!skip_singlestep(p, regs, kcb))setup_singlestep(p, regs, kcb, 0);return 1;}} /* else: not a kprobe fault; let the kernel handle it */......
}
执行 break_handler 函数:longjmp_break_handler,之后在设置为单步执行模式,与kprobe后续一致。
3.5 longjmp_break_handler
int __kprobes longjmp_break_handler(struct kprobe *p, struct pt_regs *regs)
{struct kprobe_ctlblk *kcb = get_kprobe_ctlblk();u8 *addr = (u8 *) (regs->ip - 1);struct jprobe *jp = container_of(p, struct jprobe, kp);if ((addr > (u8 *) jprobe_return) &&(addr < (u8 *) jprobe_return_end)) {if (stack_addr(regs) != kcb->jprobe_saved_sp) {struct pt_regs *saved_regs = &kcb->jprobe_saved_regs;printk(KERN_ERR"current sp %p does not match saved sp %p\n",stack_addr(regs), kcb->jprobe_saved_sp);printk(KERN_ERR "Saved registers for jprobe %p\n", jp);show_regs(saved_regs);printk(KERN_ERR "Current registers\n");show_regs(regs);BUG();}*regs = kcb->jprobe_saved_regs;memcpy((kprobe_opcode_t *)(kcb->jprobe_saved_sp),kcb->jprobes_stack,MIN_STACK_SIZE(kcb->jprobe_saved_sp));preempt_enable_no_resched();return 1;}return 0;
}
恢复探测点上下文:寄存器和堆栈内容,打开内核抢占。然后后面开始执行单步模式,恢复 kprobe 原有执行路径。
四、Deprecated Features
Jprobes现在已被弃用。依赖它的人应该迁移到其他跟踪功能或使用较旧的内核。请考虑将工具迁移到以下选项之一:
(1) 使用 trace-event 跟踪带有参数的目标函数
trace-event 是一个低开销的静态定义的事件接口(如果关闭,几乎没有可见的开销)。您可以定义新事件,并通过ftrace或任何其他跟踪工具对其进行跟踪。
请参考:
https://lwn.net/Articles/379903/
https://lwn.net/Articles/381064/
https://lwn.net/Articles/383362/
(2) 将ftrace动态事件(kprobe event)与 perf-probe 一起使用
如果使用调试信息(CONFIG_debug_info=y)构建内核,则可以使用 perf-probe 查找分配给哪个本地变量或参数的寄存器/堆栈,并设置新事件来跟踪它。
请参考:
https://static.lwn.net/kerneldoc/trace/kprobetrace.html
https://static.lwn.net/kerneldoc/trace/events.html
tools/perf/Documentation/perf-probe.txt
五、使用 perf-probe 获取函数参数
(1)从调试符号表中查询 do_sys_open 的所有参数:perf probe -V do_sys_open ,如果这个命令执行失败,就说明调试符号表还没有安装, yum --enablerepo=base-debuginfo install -y kernel-debuginfo-$(uname -r)。
[root@localhost ~]# perf probe -V do_sys_open
Available variables at do_sys_open@char*   filenameint     dfdint     flagsstruct open_flags       opumode_t mode
(2)找出参数名称和类型后,就可以把参数加到探针中了。
获取参数:filename:string
(3)添加带参数的探针:perf probe --add ‘do_sys_open filename:string’
[root@localhost ~]# perf probe --add 'do_sys_open filename:string'
Added new event:probe:do_sys_open    (on do_sys_open with filename:string)You can now use it in all perf tools, such as:perf record -e probe:do_sys_open -aR sleep 1
(4)采样记录
perf record -e probe:do_sys_open -aR ls
[ perf record: Woken up 1 times to write data ]
[ perf record: Captured and wrote 0.557 MB perf.data (12 samples) ]
(5)查看结果
[root@localhost ~]# perf scriptperf 17873 [003] 372605.184198: probe:do_sys_open: (ffffffff95c3fdf0) filename_string="/proc/17880/status"ls 17880 [001] 372605.184591: probe:do_sys_open: (ffffffff95c3fdf0) filename_string="/etc/ld.so.cache"ls 17880 [001] 372605.184609: probe:do_sys_open: (ffffffff95c3fdf0) filename_string="/lib64/libselinux.so.1"ls 17880 [001] 372605.184642: probe:do_sys_open: (ffffffff95c3fdf0) filename_string="/lib64/libcap.so.2"ls 17880 [001] 372605.184664: probe:do_sys_open: (ffffffff95c3fdf0) filename_string="/lib64/libacl.so.1"ls 17880 [001] 372605.184686: probe:do_sys_open: (ffffffff95c3fdf0) filename_string="/lib64/libc.so.6"ls 17880 [001] 372605.184713: probe:do_sys_open: (ffffffff95c3fdf0) filename_string="/lib64/libpcre.so.1"ls 17880 [001] 372605.184734: probe:do_sys_open: (ffffffff95c3fdf0) filename_string="/lib64/libdl.so.2"ls 17880 [001] 372605.184757: probe:do_sys_open: (ffffffff95c3fdf0) filename_string="/lib64/libattr.so.1"ls 17880 [001] 372605.184777: probe:do_sys_open: (ffffffff95c3fdf0) filename_string="/lib64/libpthread.so.0"ls 17880 [001] 372605.185151: probe:do_sys_open: (ffffffff95c3fdf0) filename_string=""ls 17880 [001] 372605.185203: probe:do_sys_open: (ffffffff95c3fdf0) filename_string="."(6)删除探针
[root@localhost ~]# perf probe --del probe:do_sys_open
Removed event: probe:do_sys_open
总结
jprobe基于kprobe实现,不能在函数的任意位置插入探测点,只能在函数的入口处探测,一般用于获取函数的入参值,一个被探测函数点只能注册一个jprobe。
高版本已经不推荐使用jprobe。
参考资料
https://lwn.net/Articles/132196/
https://blog.csdn.net/luckyapple1028/article/details/54350410
https://blog.csdn.net/qq_34908601/article/details/123772569
https://cloud.tencent.com/developer/article/1462867